
It is hard to believe that it’s already mid-October, and another winter is fast approaching! It is that time of the year when we release our annual preliminary winter outlook for the upcoming winter. For anyone that clicked on this article for the actual outlook, feel free to scroll to the bottom. However, why not learn a few things about meteorology?
Technical Discussion
We always begin the technical discussion by looking at the ENSO, as it is the single most important factor in a winter outlook. The state of the ENSO is determined by sea surface temperature anomalies in the Equatorial Pacific. When water temperatures are warmer than normal in this region, we develop what is called an El Nino. When water temperatures are cooler in this region, we develop a La Nina. For this upcoming winter, we are anticipating a weak El Nino as sea surface temperature anomalies will generally be 0.5-1.0C above normal. To further specify, we are expecting a west-based El Nino.
To produce an outlook for an entire season, you must have a set of analogs that have closely-matched teleconnections. Analogs are years where certain factors and observations were similar to what is current and anticipated for this upcoming winter. These factors include the ENSO, QBO, PDO, AMO, and more. Because this is only a preliminary winter outlook, we have several analogs. For our official winter outlook that will be released in November, this list will be narrowed down. For now, here is a look at our analogs for this winter: 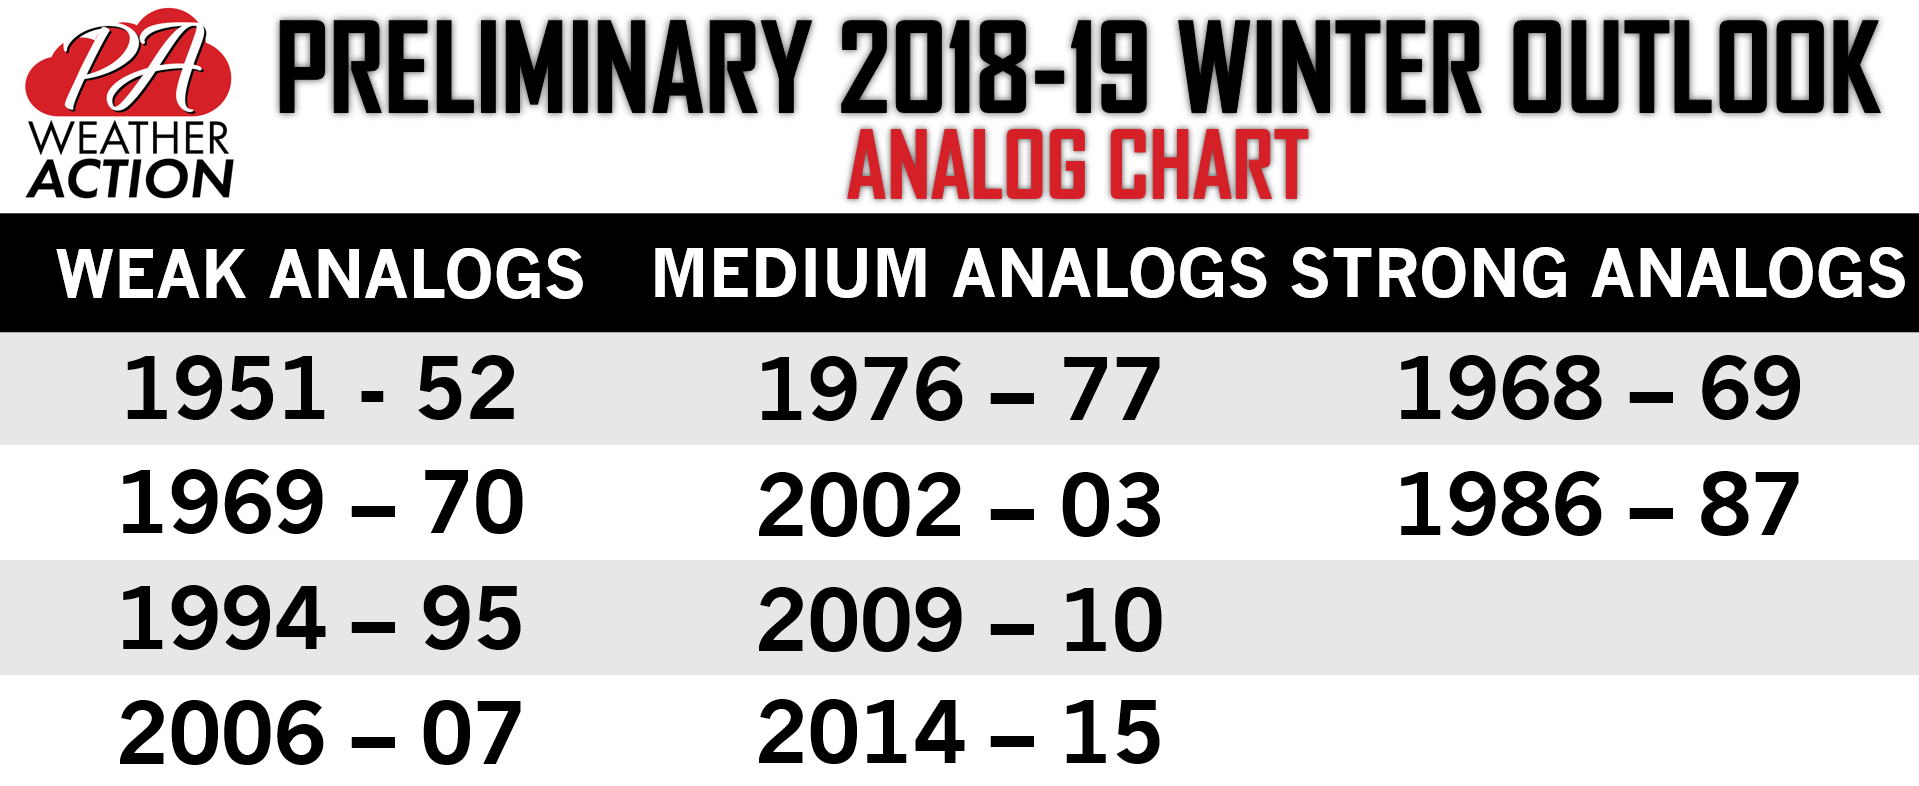
When we look at the analogs we have listed and compare the sea surface temperature anomalies from this October versus the month of October from our analogs, we get relatively similar sea surface temperatures.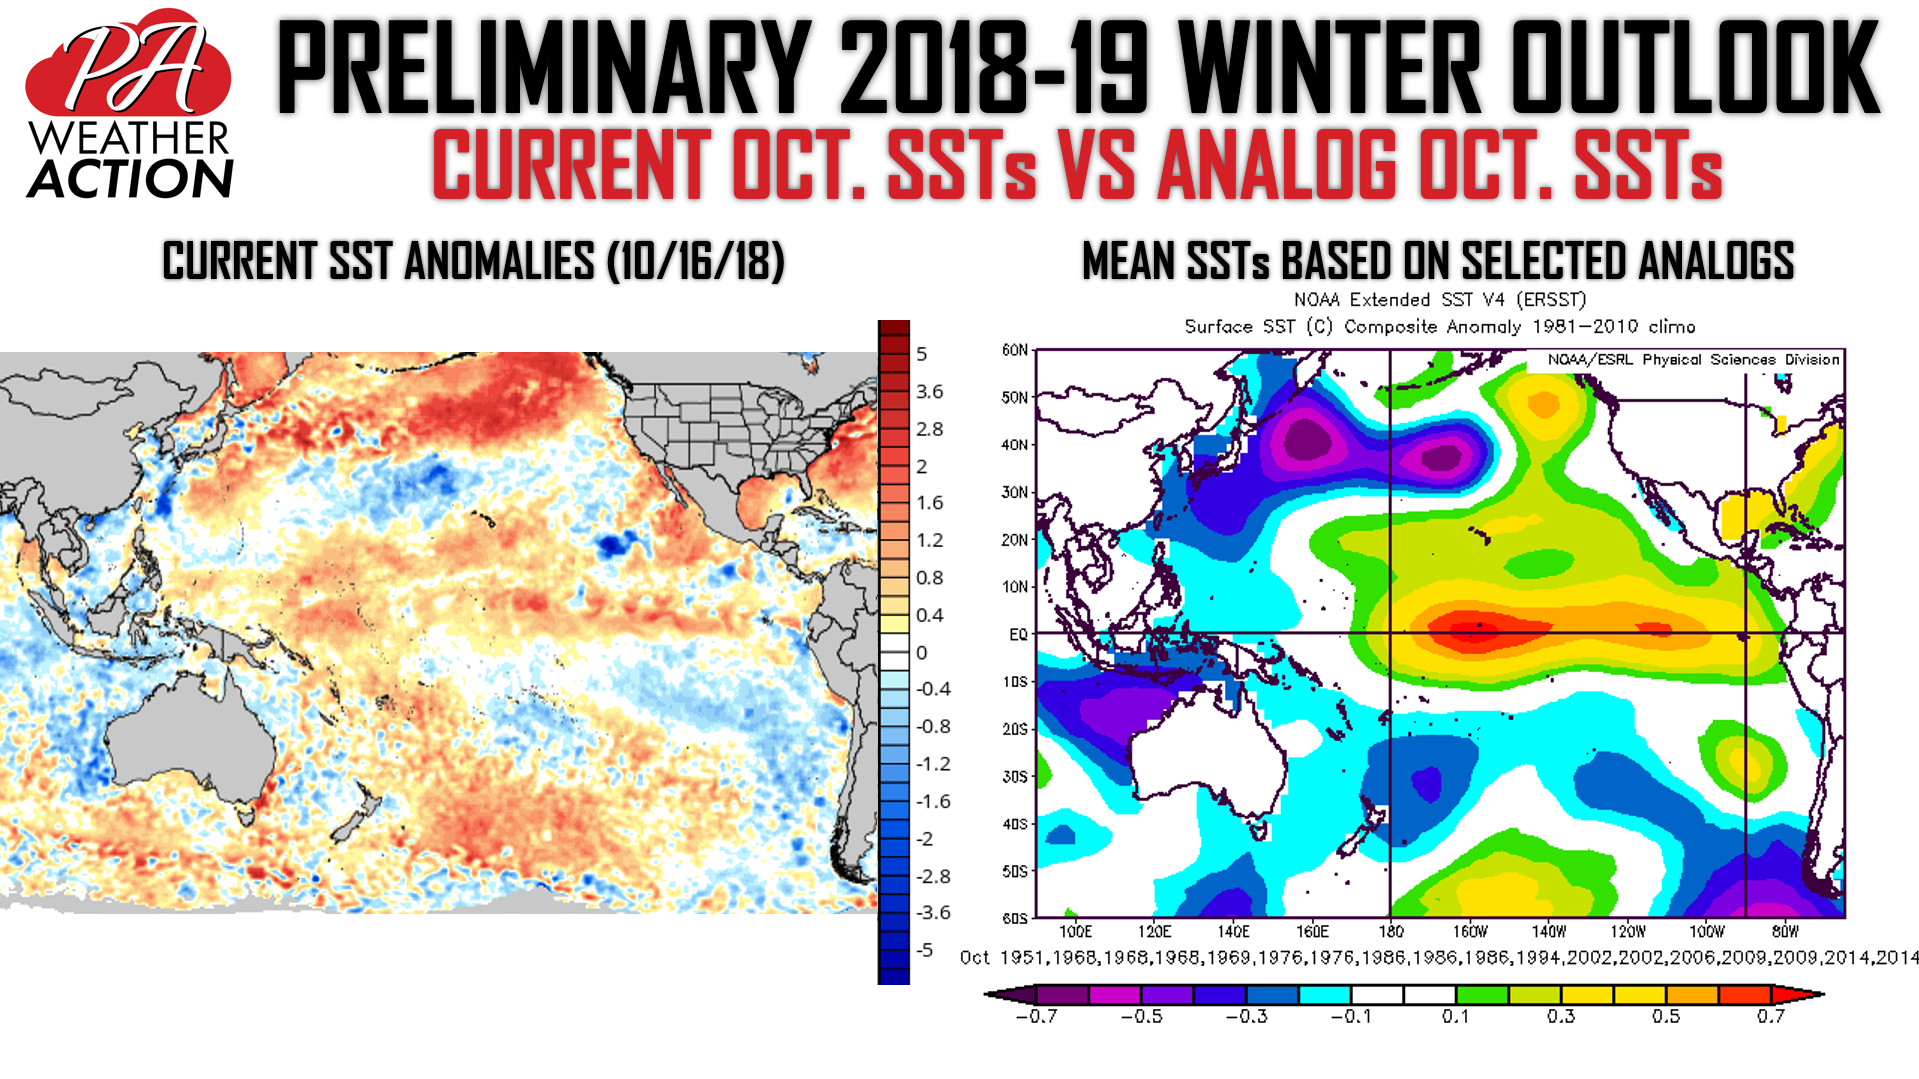
There is an abundance of similarities in the two images. Not only is the ENSO region similar with warmer sea surface temperatures along the Equatorial Pacific, but also notice the warm pool of water over the Gulf of Alaska and as well as the Gulf of Mexico and East Coast of the United States. The warmer sea surface temperatures over the Equatorial Pacific will allow for an active sub-tropical jet stream. The warm pool of SSTs in the Gulf of Alaska will help generate ridging over the West Coast, likely causing troughing (below average temps.) in the central and eastern US. Above average SSTs in the Gulf of Mexico will allow the opportunity for large coastal storms this season with more moisture to work with. Now for areas closer to the coast, because Atlantic Ocean temperatures are warmer than normal, this may result in rain or mix storms early in the season. But we anticipate that to change as we move deeper into the winter months.
As we take our analogs into the winter months, here is what our sea surface temperature anomalies look like: 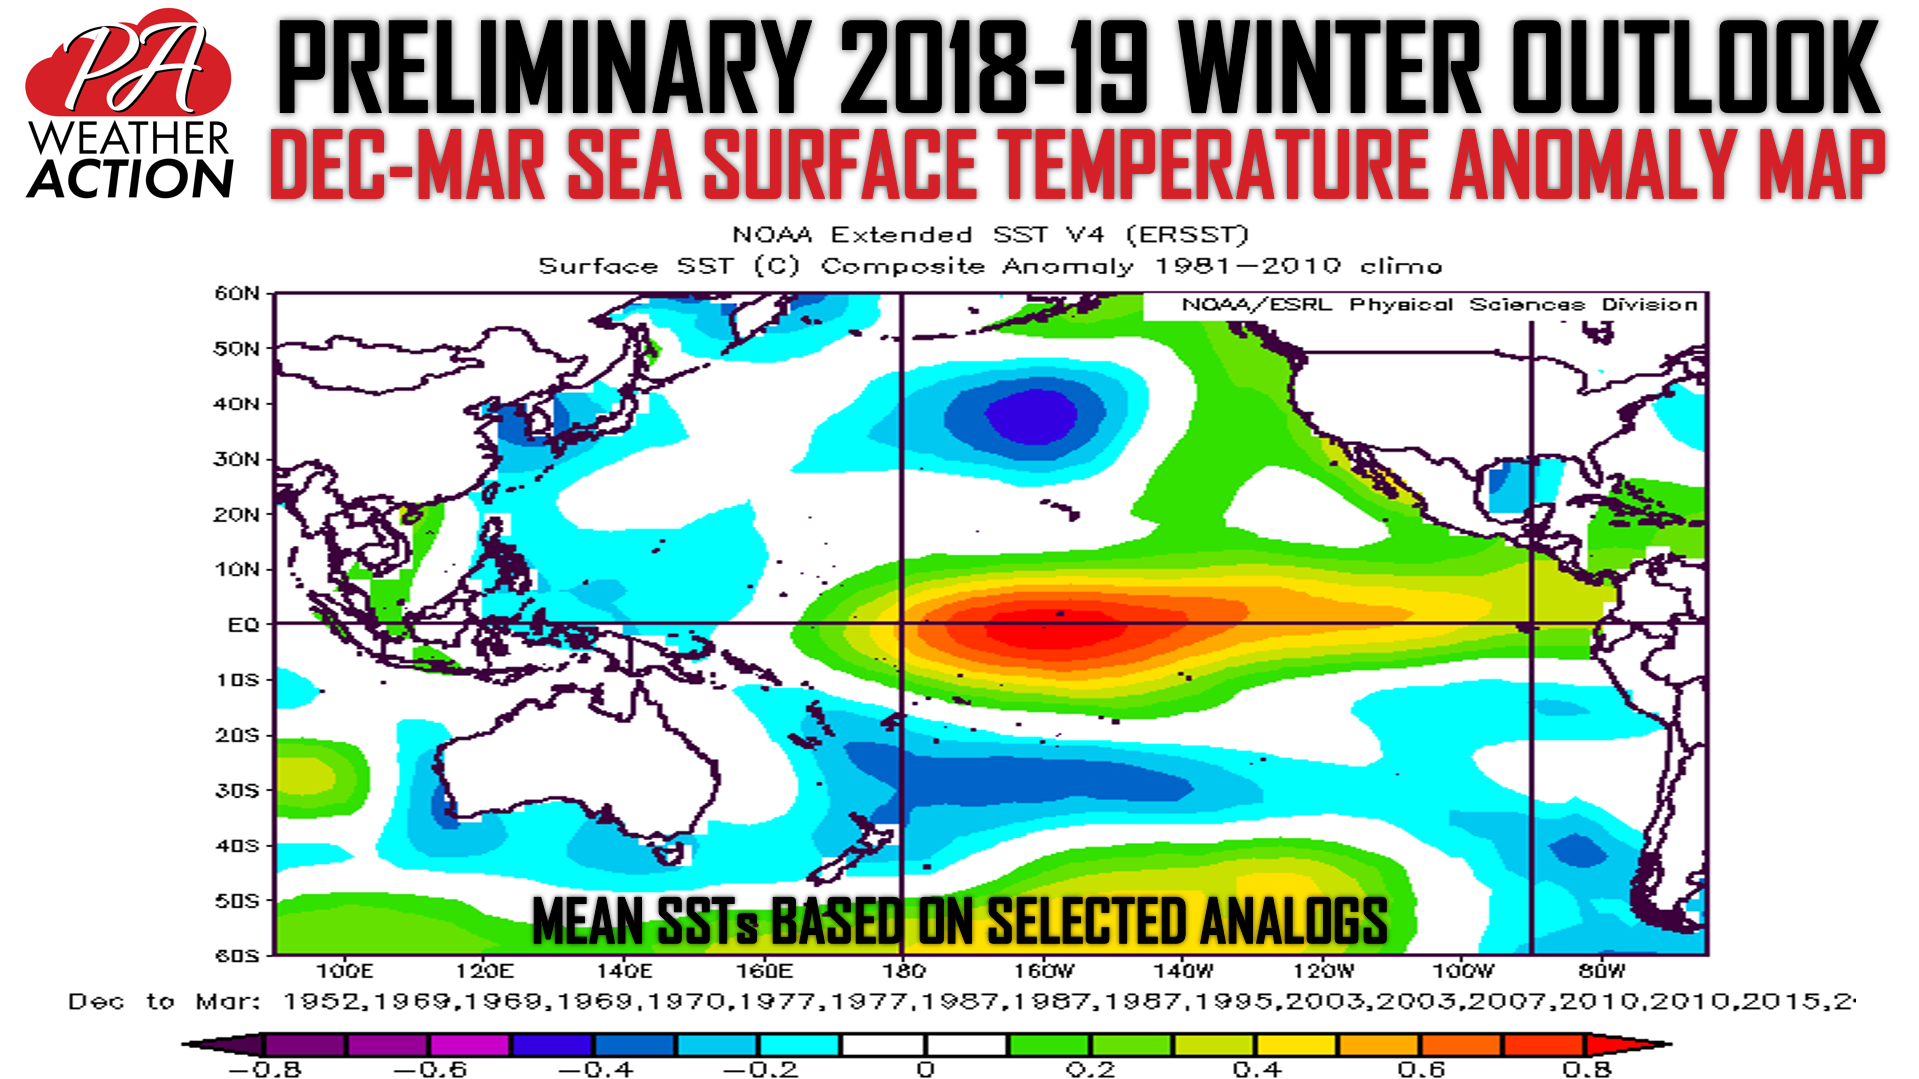
The only big difference in the sea surface temperatures for the winter months is the waters over the Gulf of Mexico and East Coast are around average or cooler than normal. This is over a four month period during these select years so it makes sense for these areas to cool off.
Now we take the same analog years and look at the temperature and precipitation anomalies (departure from normal) during those winters: 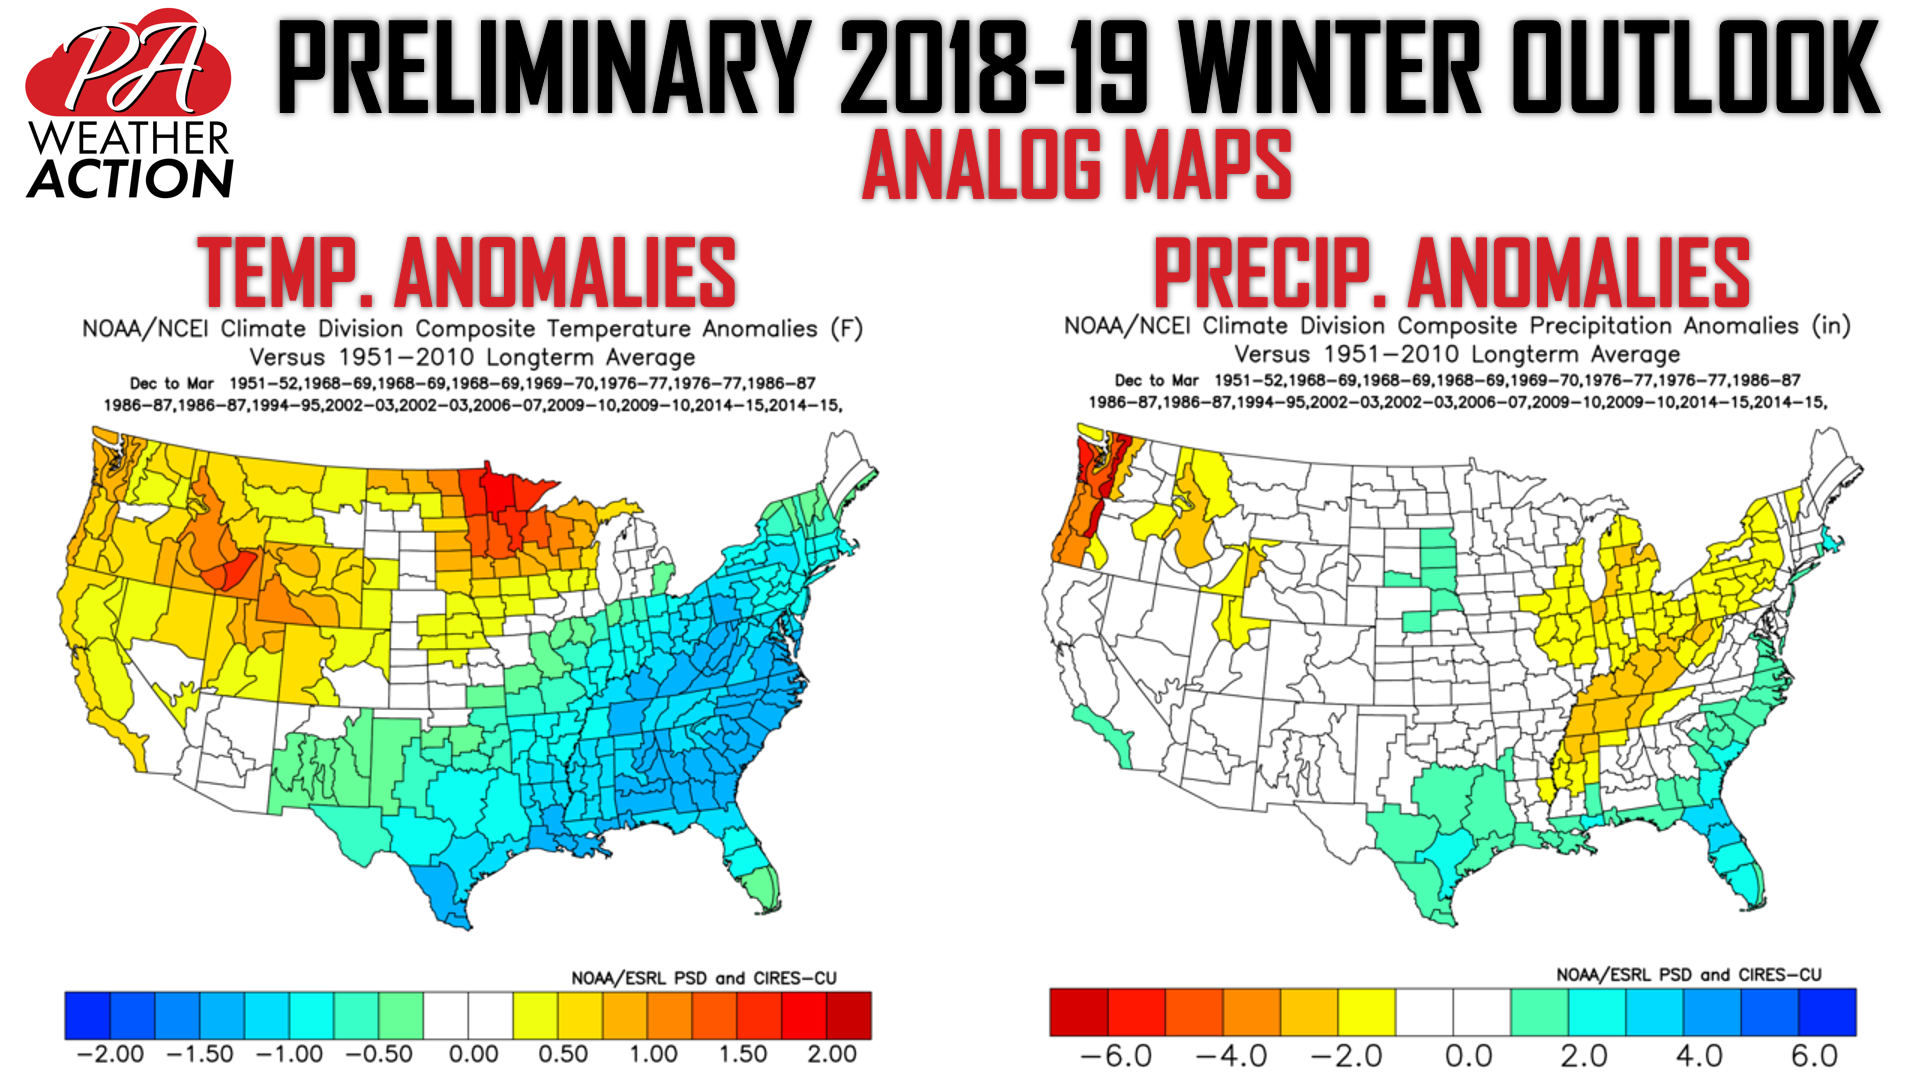
The general theme for the listed analogs is a slightly colder than average winter with average to slightly below average precipitation across Pennsylvania. Now that is precipitation and not snowfall. Another takeaway from these the precipitation anomalies is the wetter than normal conditions across the southern states as well as the Southeast and Mid-Atlantic coastal areas. This is another indicator of an active sub-tropical jet stream.
Although we are not going to post specific model forecasts for an entire season, two of the top “go-to” models for winter forecasting, the Jamstec and the European monthlies also indicate an active sub-tropical jet stream with colder than normal temperatures allowing, especially during the second half of the winter.
The last thing we will look at is current snowpack in the high latitudes and even US. We believe snowpack in Canada has greater significance than snowpack in Siberia, when it comes down to generating and locking in cold air in the Eastern US. Here is a look at current snowpack in the high latitudes, versus last year’s snowpack:
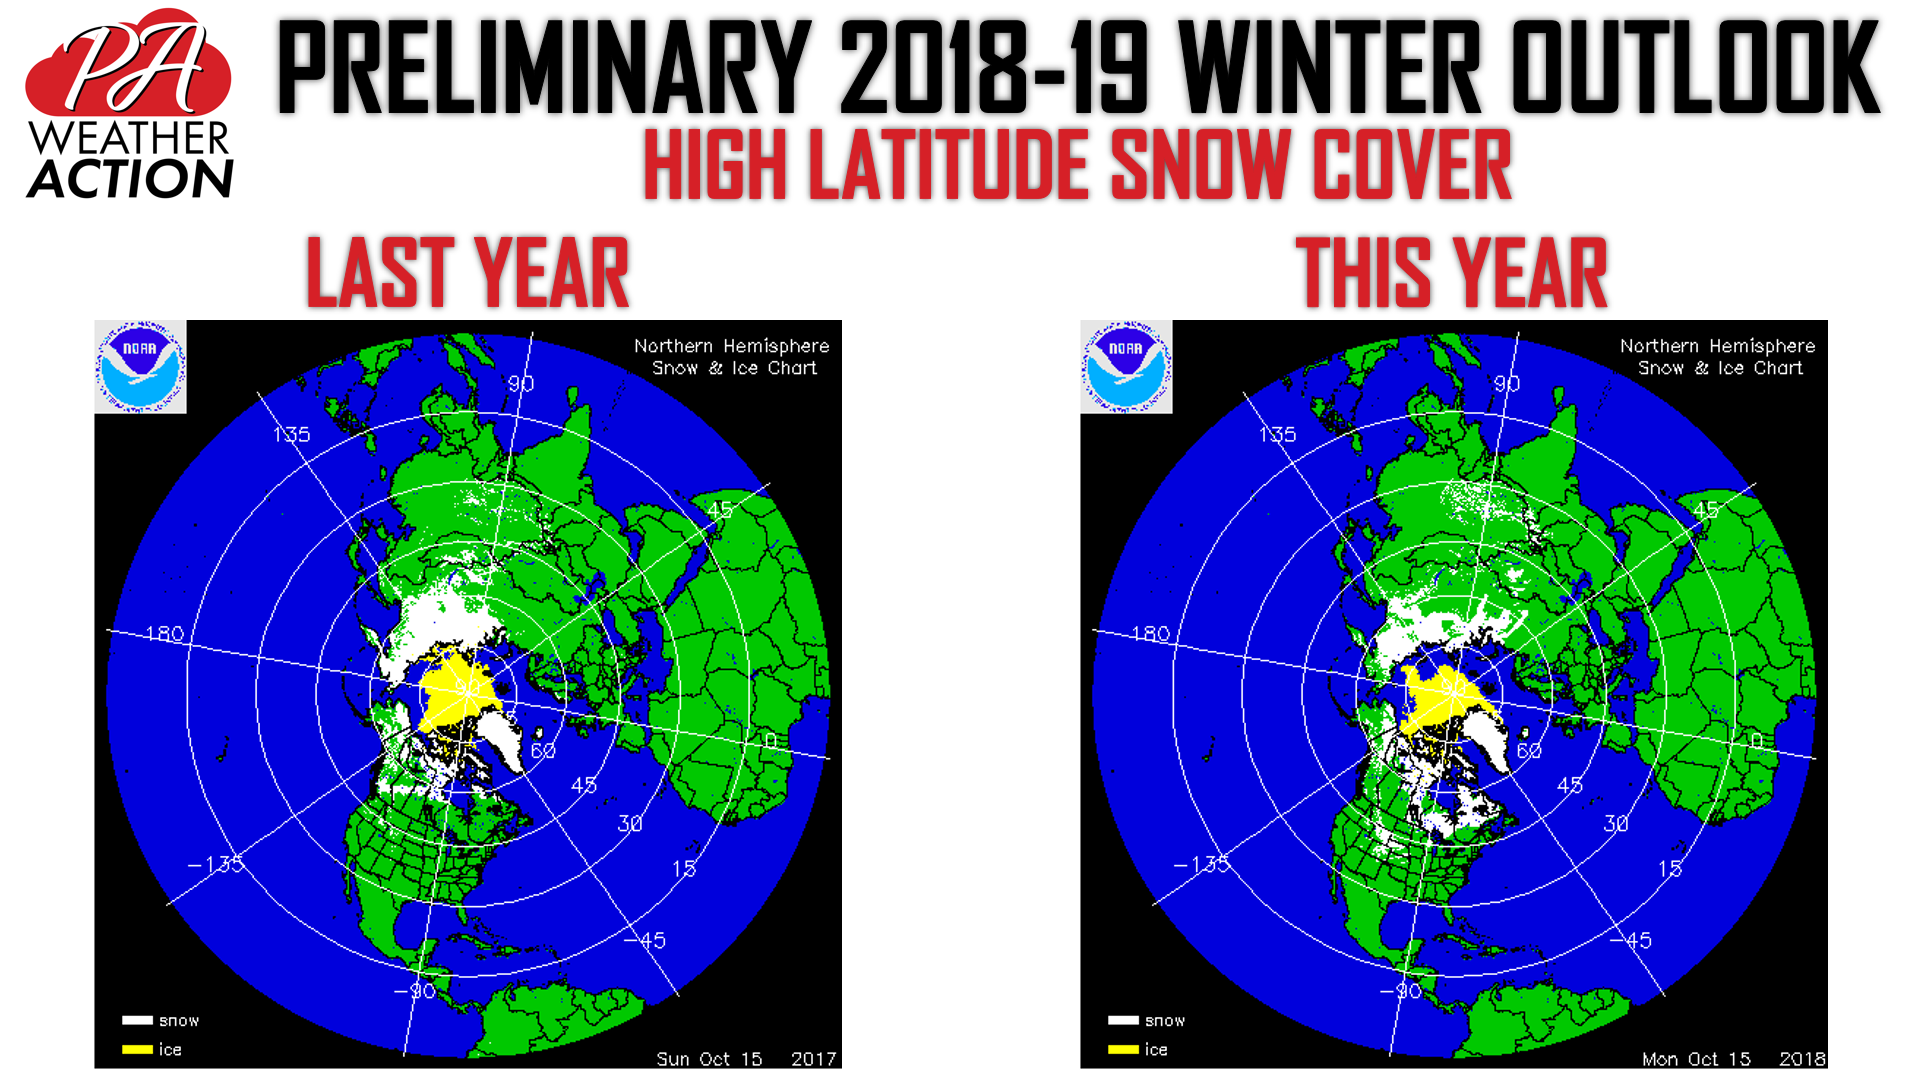
Canadian snowpack is more widespread this year, especially in central and eastern Canada. Troughs will have an easier time maintaining strength as they dip down into the US when they have a cold air support to the north. Now we will take a quick look at US snowfall so far this season compared to previous seasons:
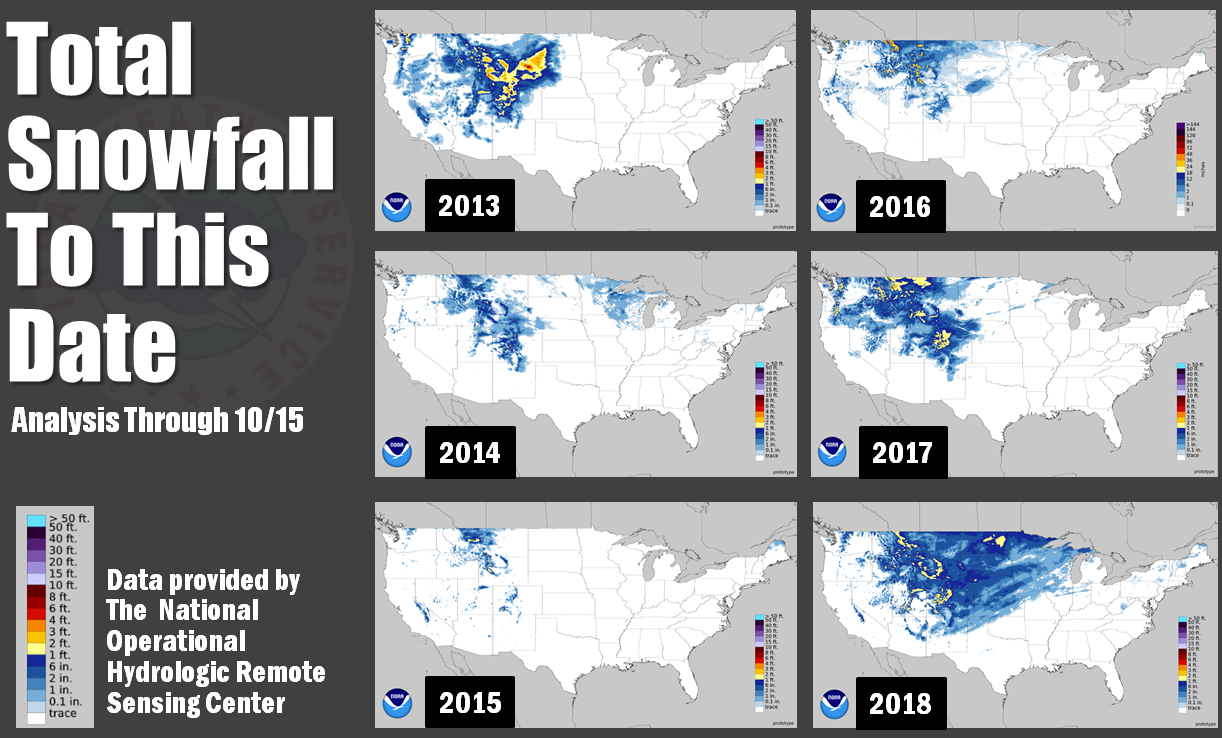
As you can see, we’ve seen far more snowfall in the Rockies and Central US this year compared to previous years, which is a good sign for snow-lovers. Let’s get into our preliminary temperature and snowfall outlooks!
2018-2019 WINTER TEMPERATURE OUTLOOK
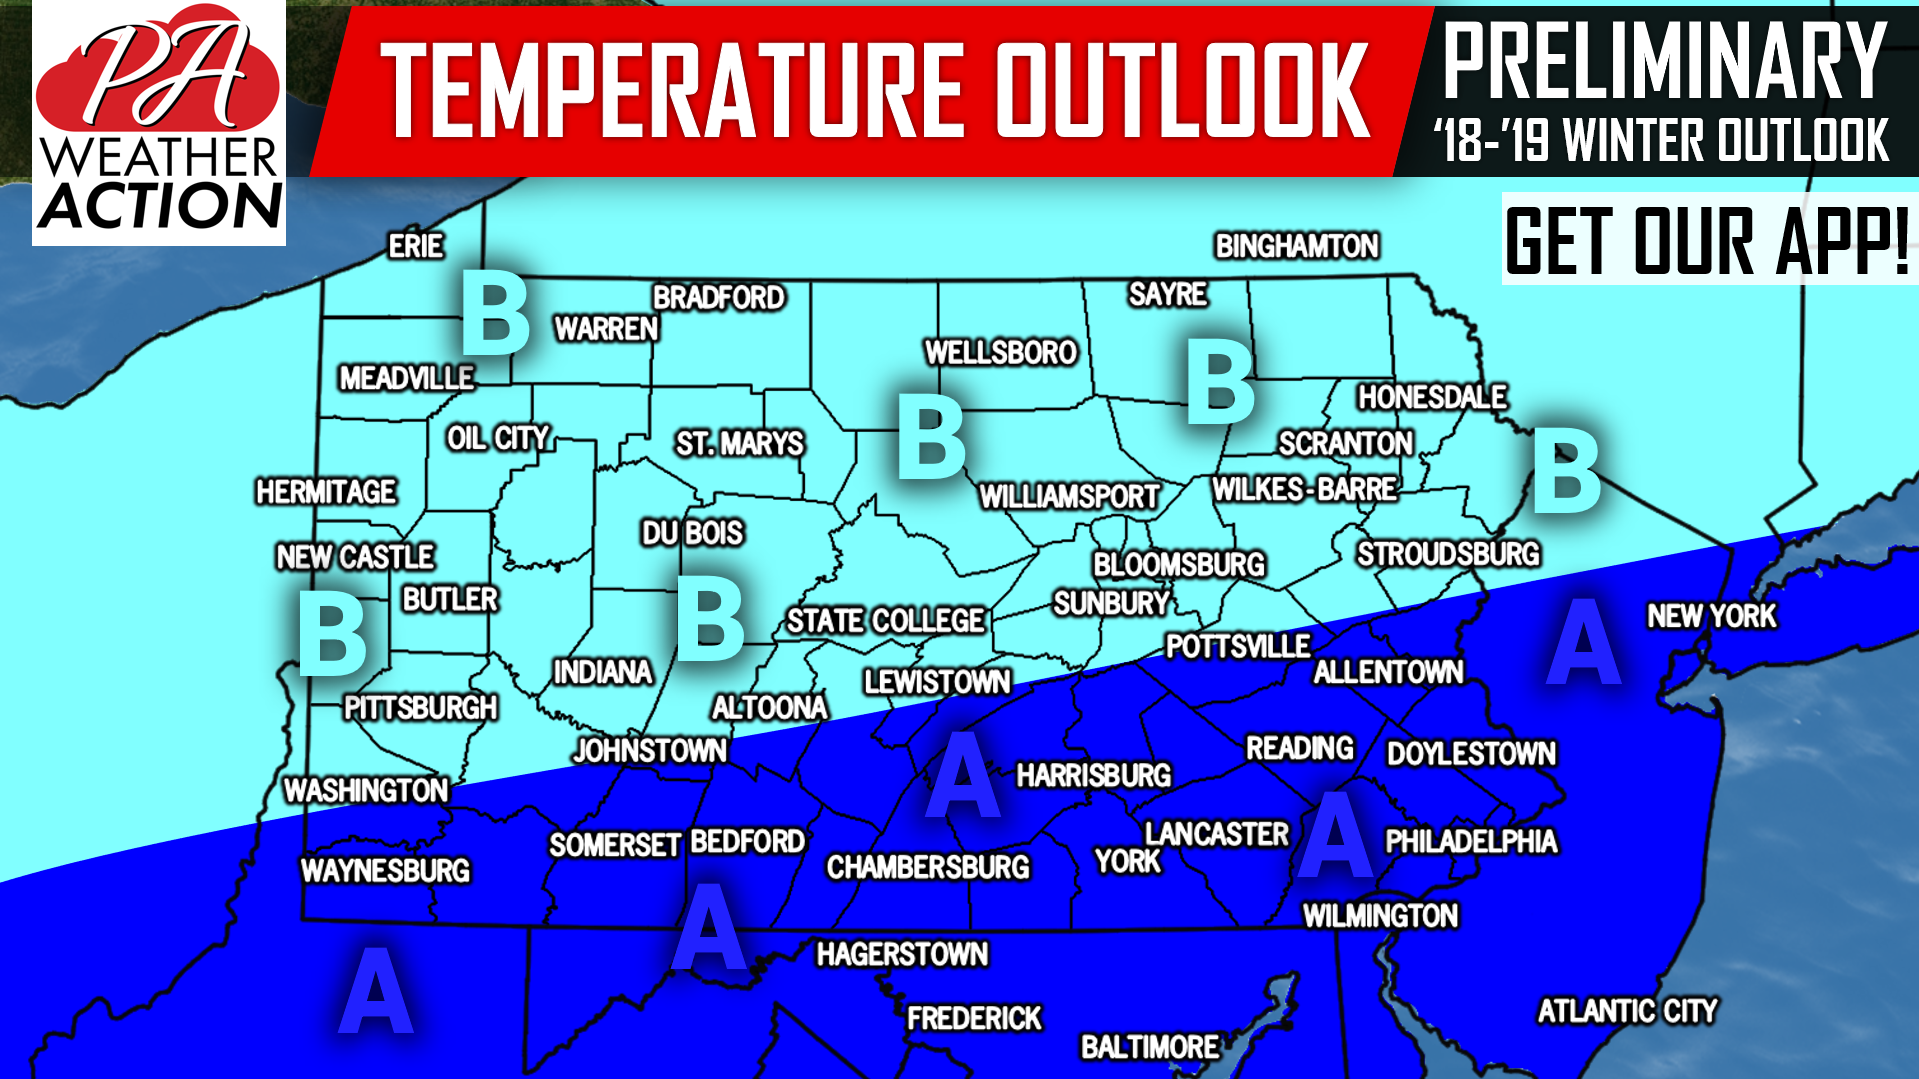
Area A: Slightly below average temperatures expected. Relatively consistent cold shots, with short periods of warmth possible. We anticipate temperatures to average .5 to 1.5 degrees below normal during this four month period.
Area B: Average temperatures expected. Temperature swings in this region will lead to an average of +/- .5 degree.
2018-2019 SNOWFALL OUTLOOK
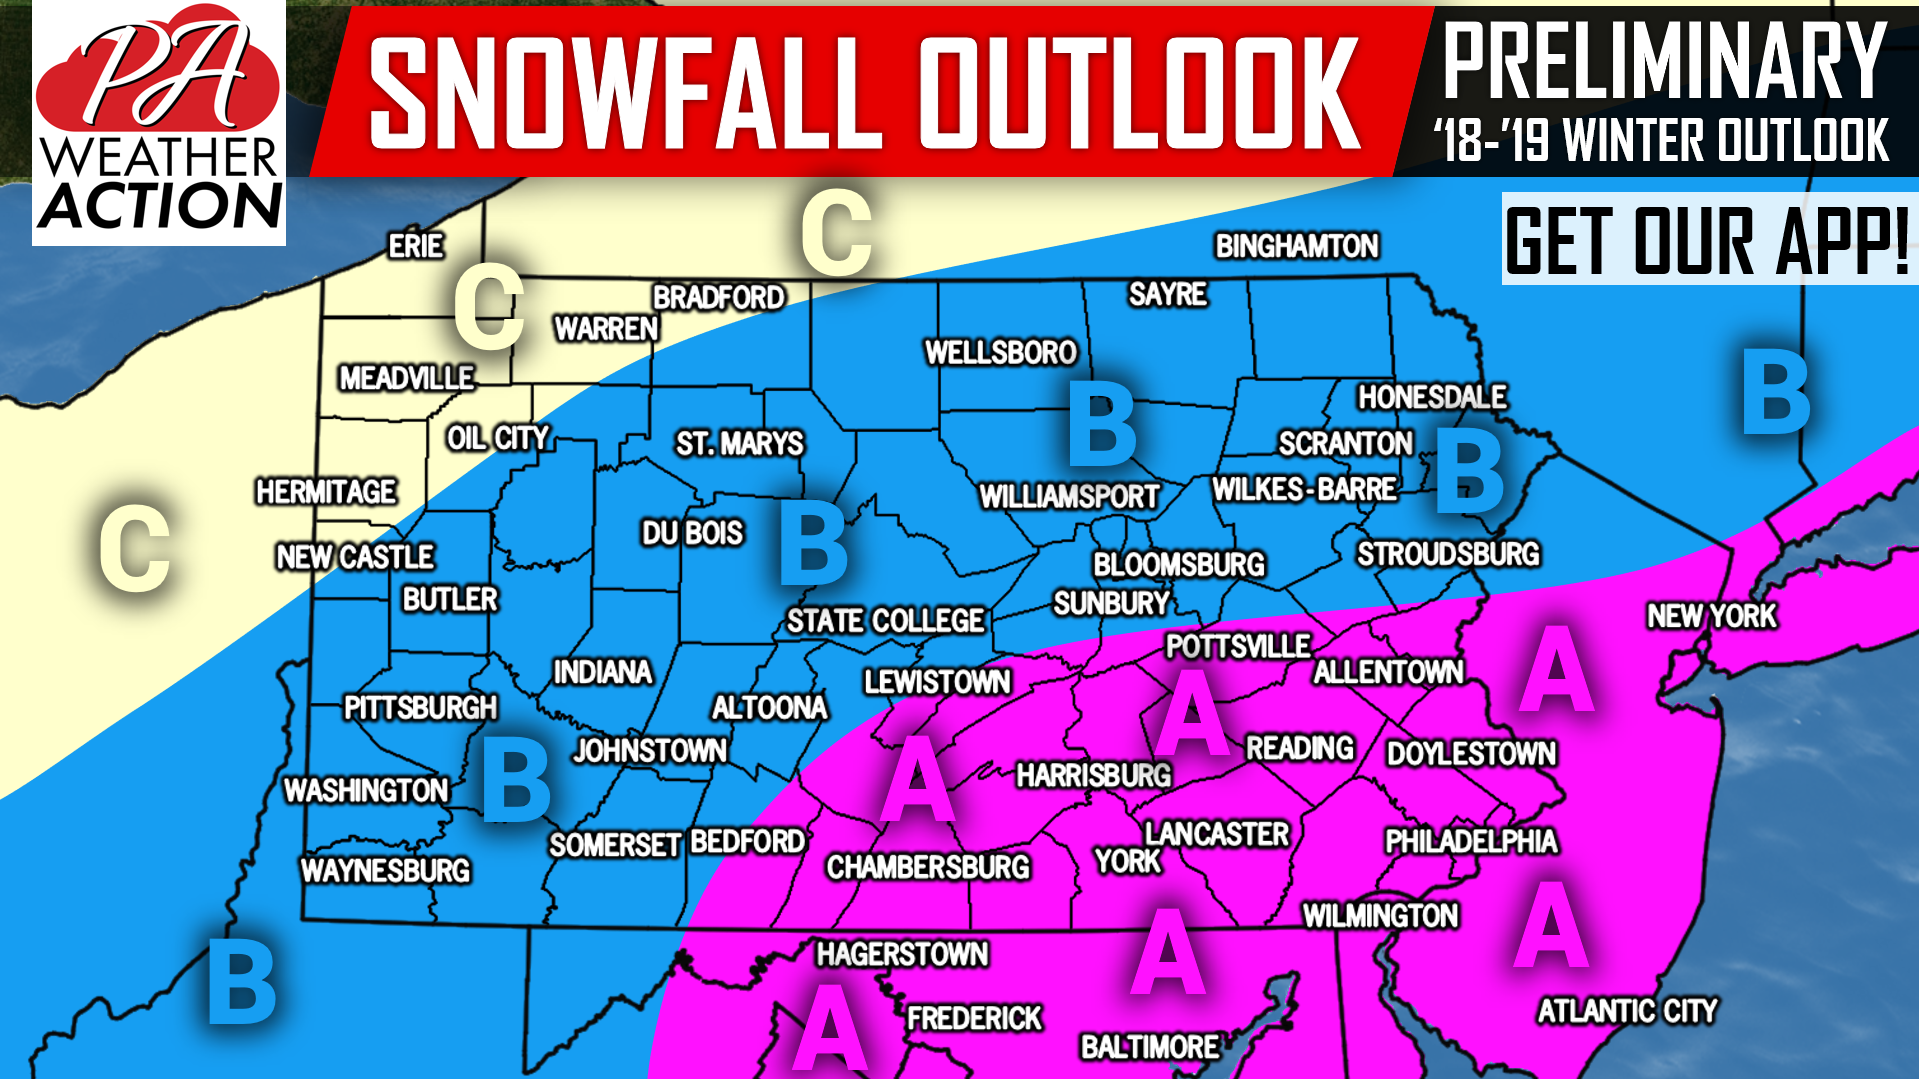
Area A: Above average snowfall is expected within this region. We expect frequent small to medium-sized snow and/or mixed-precipitation events, with a few major coastal storms.
Area B: Average snowfall is anticipated in this region. There may be a decent amount of storms in which this area gets missed to the south and east.
Area C: Below average snowfall. We expect below average lake effect snowfall.
These are our thoughts for this winter as of now! Remember to check back in November for our official winter outlook. Last year’s winter outlook verified well as a whole, so sure to download our app for your latest hourly and daily forecast, alerts, high conditions, and latest updates as we head into the snow season >>> PA Weather App Link
Share the winter outlook with your friends and family using the button below, thanks for reading!
You must be logged in to post a comment.